

Unleashing Efficiency: A Deep Dive into Process Mapping
Process mapping techniques provide a visual roadmap for understanding and optimizing how work gets done. This curated list explores eight essential process mapping techniques, each with specific applications and benefits. From simple flowcharts to complex BPMN diagrams, you'll discover the right tools to analyze and streamline your processes. Mastering these techniques is crucial for improving efficiency, reducing costs, and boosting customer satisfaction. This guide helps bootstrapped tech startups, small business owners, and marketing/operations teams alike uncover hidden inefficiencies.
This listicle delivers actionable insights and practical examples, avoiding generic advice. You will learn:
- How to choose the right process mapping technique for your specific needs
- Step-by-step outlines for implementing each technique
- Real-world examples of how these techniques drive results
- Best-use scenarios for each process mapping method
We'll cover these key process mapping techniques:
- Flowcharts
- Value Stream Mapping (VSM)
- Swimlane Diagrams
- SIPOC Diagrams
- Business Process Model and Notation (BPMN)
- Process Maps with Metrics
- Workflow Diagrams
- Top-Down Process Maps
This deep dive into process mapping techniques empowers you to analyze workflows, identify bottlenecks, and implement improvements. Whether you aim to optimize sales funnels, streamline operations, or improve project management, effective process mapping is key. Let's explore these powerful tools to unlock your organization's full potential.
1. Flowcharts
Flowcharts are a cornerstone of process mapping techniques. They provide a clear, visual depiction of a workflow, using standardized symbols to represent various stages. These symbols illustrate different actions, decisions, and the overall flow of the process. Flowcharts are especially effective in breaking down complex procedures into digestible steps, making them easier to understand and analyze. This fundamental approach makes them widely applicable across diverse fields.

Understanding Flowchart Components
The effectiveness of a flowchart lies in its standardized symbols. Each symbol has a specific meaning, ensuring consistent interpretation across different users and contexts. Common symbols include ovals for start/end points, rectangles for processes, diamonds for decisions, and arrows to indicate the direction of flow. This standardized visual language makes flowcharts readily accessible and universally understood.
Practical Applications of Flowcharts
Flowcharts find application in diverse scenarios. Examples include:
- Customer Service: Mapping complaint resolution processes to identify bottlenecks and improve efficiency.
- Manufacturing: Visualizing quality control procedures to ensure compliance and minimize errors.
- Software Development: Debugging workflows to track code execution and identify potential issues.
- Healthcare: Illustrating emergency response protocols in hospitals to coordinate actions during critical situations.
These varied applications demonstrate the versatility of flowcharts in visualizing and analyzing processes across different industries.
Tips for Effective Flowcharting
Creating impactful flowcharts requires careful planning and execution. These tips ensure clarity and effectiveness:
- Symbol Consistency: Maintain the same symbol meanings throughout the entire flowchart.
- Clear Labeling: Use concise labels for each step to avoid ambiguity.
- Logic Testing: Walk through various scenarios to validate the logic and identify potential flaws.
- Single Process Focus: Limit each flowchart to one specific process for improved clarity.
- Swimlanes for Collaboration: Employ swimlanes to visualize multi-department processes and highlight responsibilities.
By following these guidelines, flowcharts become powerful tools for process improvement and communication.
Why Use Flowcharts?
Flowcharts earn their place as a fundamental process mapping technique due to several key benefits. They offer a clear visual representation of a process, facilitating easier understanding and communication. This visual clarity is particularly helpful for onboarding new employees, troubleshooting issues, and identifying areas for improvement. Flowcharts enable stakeholders from different departments to collaborate effectively on process optimization. Their simplicity and adaptability make them an invaluable tool for any organization looking to streamline operations and improve overall efficiency. Flowcharts are a foundational technique and essential for anyone new to process mapping. They provide a clear starting point before exploring more complex methods.
2. Value Stream Mapping (VSM)
Value Stream Mapping (VSM) is a lean manufacturing technique that visualizes the flow of materials and information required to bring a product or service to the customer. It goes beyond simple process mapping by focusing on identifying value-added and non-value-added activities. This comprehensive view allows for a thorough analysis of the entire process, from raw materials to delivery, with an emphasis on eliminating waste and improving efficiency.
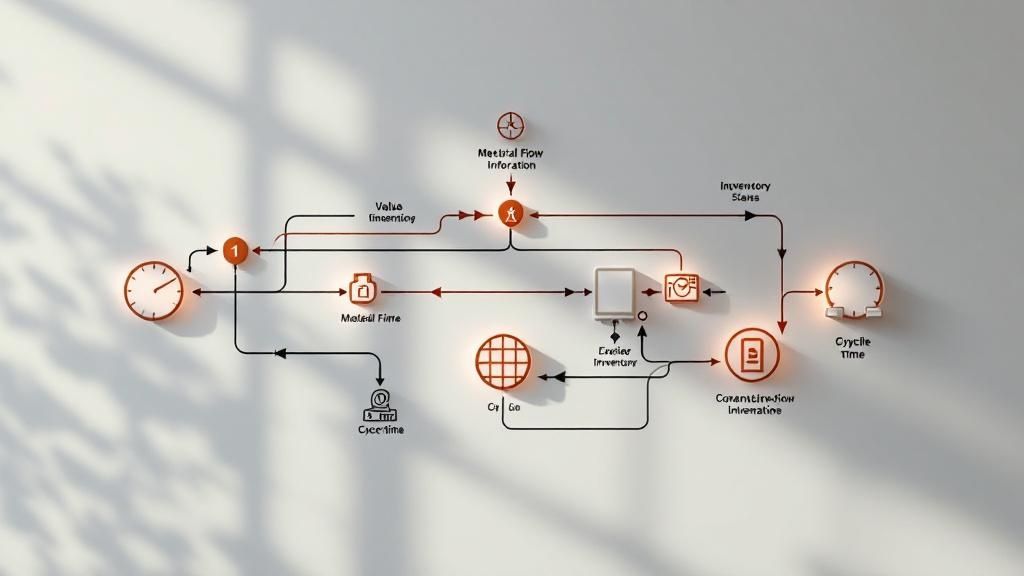
Understanding Value Stream Mapping Components
VSM employs specific symbols and icons to represent different aspects of the process. These include icons for material flow, information flow, and data boxes for metrics like cycle time, lead time, and inventory levels. Understanding these components is crucial for interpreting the map and identifying areas for improvement. This visual representation helps pinpoint bottlenecks and areas of waste.
Practical Applications of Value Stream Mapping
Value Stream Mapping is beneficial across diverse industries and processes. Some practical examples include:
- Manufacturing: Optimizing production lines to reduce lead times and improve inventory management.
- Healthcare: Streamlining patient journeys from admission to discharge, minimizing wait times and enhancing patient experience.
- Software Development: Mapping the entire software development lifecycle to identify inefficiencies and accelerate delivery.
- Supply Chain Management: Visualizing the flow of goods and information throughout the supply chain, improving logistics and reducing costs.
These diverse applications highlight VSM's adaptability in visualizing and analyzing processes across different sectors.
Tips for Effective Value Stream Mapping
Creating effective Value Stream Maps requires a structured approach. These tips help ensure accuracy and impact:
- Walk the Process: Physically observe the process firsthand (gemba walk) to gain a true understanding of the workflow.
- Focus on One Product Family: Start by mapping the value stream for a single product family to avoid unnecessary complexity.
- Gather Data at the Source: Collect data directly from the process, ensuring accuracy and avoiding assumptions.
- Involve Stakeholders: Engage all relevant stakeholders in the mapping process to gain diverse perspectives and foster buy-in.
- Current State then Future State: Begin by mapping the current state of the process before designing the ideal future state.
Following these guidelines ensures that the VSM accurately reflects the process and provides a solid foundation for improvement initiatives.
Why Use Value Stream Mapping?
VSM provides a powerful visual representation of the entire value stream, highlighting both value-added and non-value-added activities. This clarity enables organizations to identify and eliminate waste, improving efficiency and reducing costs. VSM fosters collaboration among stakeholders, leading to more effective process improvement initiatives. Its focus on customer value makes it a valuable tool for any organization seeking to streamline operations and enhance customer satisfaction. This technique is particularly valuable for those looking to implement lean principles and achieve significant process optimization.
3. Swimlane Diagrams
Swimlane diagrams provide a clear visual representation of who does what within a process. They organize process steps into parallel lanes, each representing a different actor, department, role, or system. This layout clarifies responsibilities, handoffs, and cross-functional interactions, making complex processes easier to understand and analyze. Swimlane diagrams are particularly helpful for identifying bottlenecks and streamlining workflows that involve multiple stakeholders.
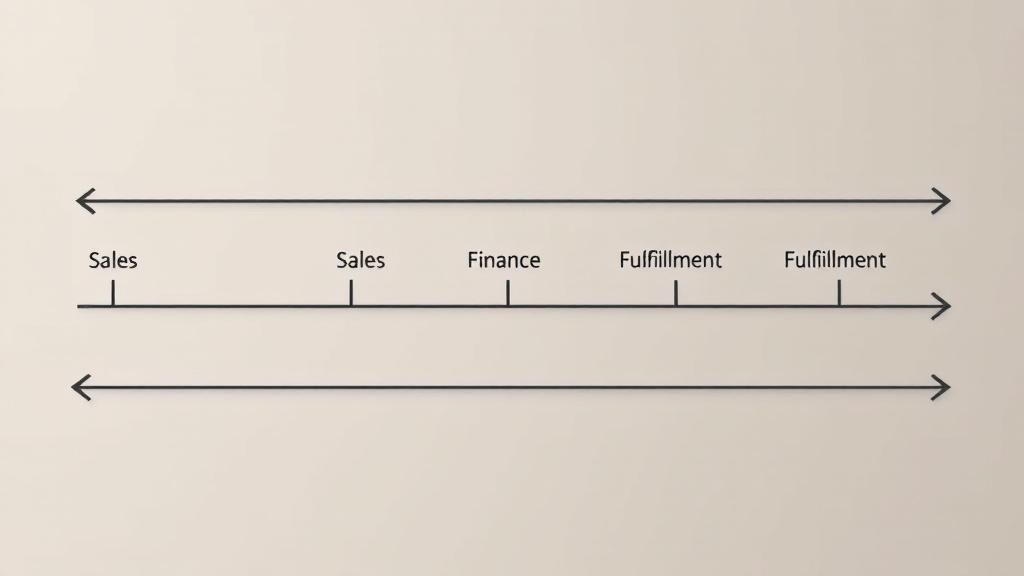
Understanding Swimlane Components
The power of swimlane diagrams lies in their visual organization. Each "swimlane" represents a distinct actor or department involved in the process. Steps within a lane belong to that specific actor's responsibility. Arrows connecting steps across lanes visualize the flow of information and handoffs between different actors. This clear delineation of roles and responsibilities makes swimlane diagrams highly effective for identifying process bottlenecks and areas for improvement.
Practical Applications of Swimlane Diagrams
Swimlane diagrams are highly effective for visualizing processes involving multiple parties. Examples include:
- Order-to-Cash Process: Mapping the flow from sales order creation through finance, fulfillment, and shipping.
- New Employee Onboarding: Visualizing the steps across HR, IT, and the employee's department.
- Insurance Claim Processing: Tracking the interactions between the claimant, insurance adjusters, and various departments.
- Product Development: Mapping the collaboration between R&D, marketing, and manufacturing teams.
These examples highlight how swimlane diagrams clarify complex, cross-functional processes.
Tips for Effective Swimlane Diagramming
Creating clear and effective swimlane diagrams requires a structured approach. These tips can help:
- Clearly Defined Lanes: Precisely label each lane to represent a specific actor or department. Ensure responsibilities are clearly defined for each lane.
- Color-Coding: Differentiate lanes using distinct colors for increased visual clarity and easier interpretation.
- Minimize Lane Count: Too many lanes can make the diagram cluttered. Focus on the essential actors and consider grouping related roles if necessary.
- Clear Handoffs: Use connector arrows to explicitly show the transfer of responsibility between lanes. Label these arrows with the information being transferred.
- Highlight Decision Points: Clearly mark decision points within the process and indicate which actor is responsible for making the decision.
By following these guidelines, swimlane diagrams become powerful tools for process analysis and improvement.
Why Use Swimlane Diagrams?
Swimlane diagrams are particularly valuable for visualizing and analyzing cross-functional processes. They excel at clarifying roles, responsibilities, and handoffs, making it easier to identify bottlenecks, redundancies, and areas for improvement. This clear visual representation facilitates communication and collaboration among different teams. Swimlane diagrams empower organizations to streamline their operations, improve efficiency, and optimize resource allocation. They provide a clear, concise way to understand and manage complex interdepartmental processes.
4. SIPOC Diagrams
SIPOC (Suppliers, Inputs, Process, Outputs, Customers) diagrams offer a high-level view of a process. They identify key elements defining process boundaries and stakeholders. Unlike detailed process maps, SIPOC diagrams focus on the "big picture." This makes them ideal for initial process analysis and improvement initiatives. They provide a clear understanding of the process scope before diving into intricate details. This macro view makes SIPOC diagrams particularly valuable for process mapping techniques.
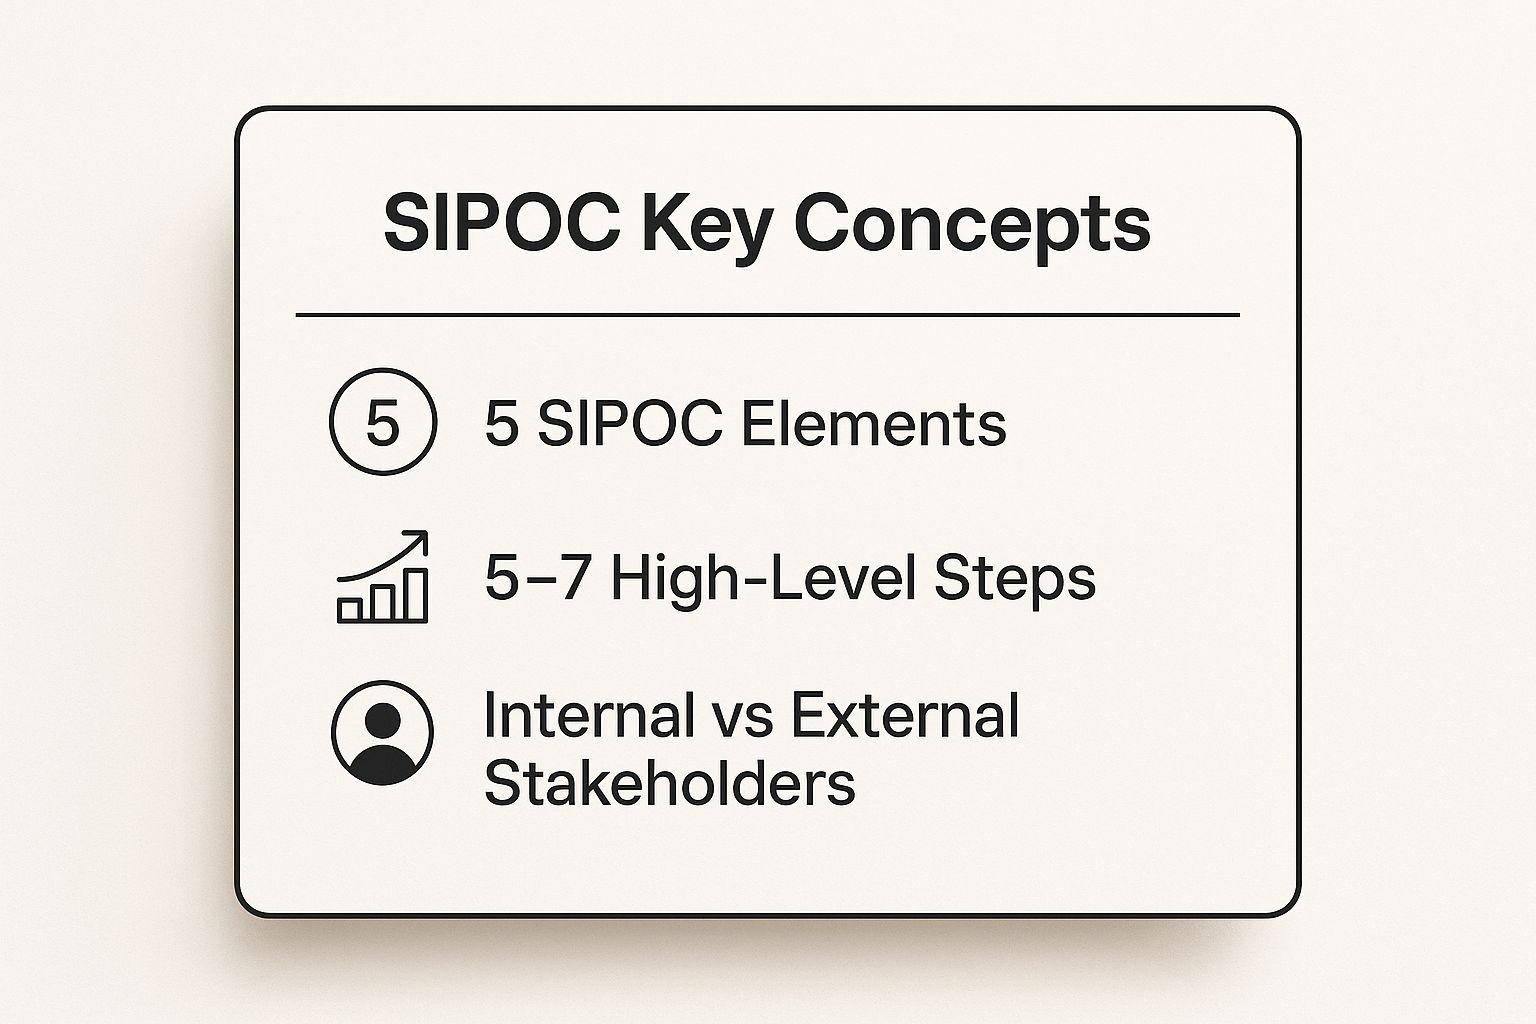
The infographic above summarizes the core aspects of SIPOC diagrams, highlighting the five key elements, the recommended number of high-level steps, and the importance of considering both internal and external stakeholders. As the infographic illustrates, keeping the process steps concise and differentiating between stakeholder types is crucial for an effective SIPOC analysis.
Understanding SIPOC Components
The SIPOC acronym represents the five key components of this process mapping technique: Suppliers, Inputs, Process, Outputs, and Customers. Suppliers provide the Inputs needed for the Process. The Process transforms these inputs into Outputs, which are then delivered to the Customers. Understanding the interplay between these elements is fundamental to using SIPOC diagrams effectively.
Practical Applications of SIPOC Diagrams
SIPOC diagrams are highly versatile and apply to various scenarios. Examples include:
- Six Sigma projects: Scoping projects focused on defect reduction.
- Service delivery: Defining processes in consulting engagements.
- Manufacturing: Providing a process overview for quality improvement initiatives.
- IT service management: Documenting key processes and stakeholders.
These examples highlight SIPOC's value in diverse fields for high-level process understanding.
Tips for Effective SIPOC Diagramming
Creating impactful SIPOC diagrams involves specific considerations. These tips ensure clarity and effectiveness:
- High-level process steps: Limit the process to 5-7 high-level steps. This ensures the diagram remains focused on the overall workflow rather than intricate details.
- Specific inputs and outputs: Clearly define the inputs required and the outputs produced by the process.
- Internal and external stakeholders: Consider both internal and external suppliers and customers to gain a comprehensive understanding of the process ecosystem.
- Foundation for detailed mapping: Use the SIPOC diagram as a starting point for more detailed process mapping activities.
- Stakeholder validation: Validate the diagram with process stakeholders to ensure accuracy and buy-in.
These guidelines help make SIPOC diagrams effective tools for process analysis.
Why Use SIPOC Diagrams?
SIPOC diagrams are invaluable for several reasons. They offer a concise, high-level overview of a process, making them ideal for initial analysis and communication. They facilitate stakeholder alignment by clearly defining roles and responsibilities. SIPOC diagrams are particularly useful in project scoping, process improvement initiatives, and identifying areas for deeper analysis. Their simplicity and broad applicability make them a valuable tool for any organization. They offer a crucial starting point for process mapping, especially when dealing with complex workflows, paving the way for more detailed analysis using other techniques. This structured approach allows for a clear understanding of the process landscape before delving into specifics, making it an essential tool for process mapping techniques.
5. Business Process Model and Notation (BPMN)
Business Process Model and Notation (BPMN) is a standardized graphical notation for representing business processes in a visual diagram. It provides a common language for business analysts, technical developers, and business managers to understand and collaborate on process design and improvement. BPMN uses a set of standardized symbols and rules, enabling precise modeling of complex business processes, from simple workflows to intricate interactions. This standardized approach facilitates clear communication and reduces ambiguity, making it a powerful tool for process mapping.
Understanding BPMN Components
BPMN utilizes a variety of symbols categorized as flow objects, connecting objects, swimlanes, and artifacts. Flow objects represent the core activities, events, and gateways within the process. Connecting objects, like sequence flows and message flows, illustrate the relationships and interactions between these elements. Swimlanes, including pools and lanes, visually separate different participants or departments involved in the process. Artifacts provide additional context and information, such as data objects and groups. Understanding these components is crucial for effective BPMN diagram interpretation and creation.
Practical Applications of BPMN
BPMN's standardized notation makes it applicable across various industries and scenarios:
- Enterprise Resource Planning (ERP) Systems: Modeling complex business processes within ERP systems to ensure smooth integration and data flow.
- Banking: Visualizing loan approval workflows to identify bottlenecks and optimize processing time.
- Healthcare: Mapping patient treatment protocols to standardize care and improve patient outcomes.
- Supply Chain Management: Illustrating the flow of goods and information across different stages of the supply chain.
These diverse applications demonstrate BPMN's versatility in visualizing and analyzing complex processes within different organizations.
Tips for Effective BPMN Modeling
Creating effective BPMN diagrams requires a structured approach:
- Start Simple: Begin with the basic elements and gradually incorporate more advanced features as needed.
- Pools and Lanes: Use pools to represent different participants and lanes to differentiate responsibilities within those participants.
- Collaboration is Key: Validate the model with both business and technical stakeholders to ensure accuracy and completeness.
- Utilize BPMN Tools: Leverage BPMN-compliant software tools to simplify diagram creation and maintenance.
- Execution Considerations: Account for model execution requirements early in the design process to ensure compatibility with automated systems.
By adhering to these guidelines, BPMN diagrams can effectively communicate complex processes and drive process improvement initiatives.
Why Use BPMN?
BPMN's value lies in its ability to provide a clear, standardized visual representation of complex business processes. This clarity facilitates better communication and collaboration between different stakeholders, including business analysts, developers, and managers. The standardized nature of BPMN allows for a shared understanding of processes across departments and organizations. This consistent approach simplifies process analysis, optimization, and automation initiatives. BPMN offers a robust framework for process mapping, moving beyond basic flowcharts to accommodate the intricacies of modern business operations. Its ability to capture details like exception handling, parallel processing, and message flows makes it invaluable for complex process modeling. Its use across various industries underscores its value as a powerful process mapping technique.
6. Process Maps with Metrics
Process maps with metrics combine traditional process mapping with quantitative data. This data includes cycle times, error rates, costs, and customer satisfaction scores. This approach provides a visual process flow combined with performance data. This combination enables data-driven improvement decisions. Integrating metrics into your process maps transforms them from static diagrams into dynamic tools for optimization.
Understanding Metric Integration
The power of process maps with metrics comes from the insights derived from hard data. By overlaying metrics onto each process step, bottlenecks, inefficiencies, and areas for improvement become readily apparent. This data-driven approach allows for targeted interventions and measurable results. It shifts the focus from subjective opinions to objective analysis.
Practical Applications of Metric-Driven Process Maps
Metric-driven process maps are highly versatile across diverse industries and processes. Consider these examples:
- Call Center Processes: Track average handle time and customer satisfaction scores to optimize call routing and agent training.
- Manufacturing Processes: Monitor cycle times and defect rates to identify production bottlenecks and improve quality control.
- Healthcare Processes: Measure patient wait times and treatment outcomes to streamline patient flow and enhance care delivery.
- Financial Processes: Analyze processing time and error rates to optimize workflows and reduce operational costs.
These examples highlight the adaptability of this technique to enhance various operational aspects.
Tips for Effective Metric Integration
Integrating metrics effectively requires careful planning and execution. These tips can guide you:
- Business Objective Alignment: Focus on metrics directly related to your key business objectives.
- Data Consistency: Ensure consistent data collection methods to maintain accuracy and reliability.
- Statistical Process Control: Use statistical process control charts to track trends and identify significant variations.
- Balanced Metrics: Include both efficiency metrics (e.g., cycle time) and effectiveness metrics (e.g., customer satisfaction).
- Data Validation: Validate data accuracy before making any process improvement decisions.
Following these guidelines ensures that your metrics provide actionable insights for informed decision-making.
Why Use Process Maps with Metrics?
Process maps with metrics are a powerful tool for process improvement. They combine the visual clarity of process mapping with the analytical power of quantitative data. This combination allows for a deeper understanding of process performance. This approach facilitates targeted improvements and data-driven decision-making. By incorporating metrics, organizations can move beyond simply understanding their processes to actively optimizing them for greater efficiency and effectiveness. This technique is especially crucial for organizations embracing data-driven cultures and seeking measurable results. It provides the evidence needed to justify process changes and demonstrate their impact. This data-driven approach becomes an essential component of continuous improvement initiatives.
7. Workflow Diagrams
Workflow diagrams provide a specialized approach to process mapping, focusing specifically on the sequence of activities and task dependencies within a process. They emphasize the flow of work through different stages and the logical relationships between tasks. This focus makes them particularly useful for project management, operational planning, and understanding how tasks contribute to the overall process completion. Workflow diagrams offer a detailed view of work execution, facilitating efficient resource allocation and schedule optimization.
Understanding Workflow Diagram Components
Workflow diagrams typically represent tasks as nodes or boxes, connected by arrows that illustrate the sequence and dependencies between them. They clearly define the start and end points of the workflow, as well as decision points that influence the flow. Some diagrams also include information about resource allocation, task durations, and deadlines. This comprehensive representation enables effective planning and execution of complex projects.
Practical Applications of Workflow Diagrams
Workflow diagrams are highly effective in various scenarios, including:
- Software Development: Managing the flow of coding, testing, and deployment activities, ensuring smooth project execution.
- Content Creation: Tracking the stages of content development, from ideation to publication, improving collaboration and efficiency.
- Construction Projects: Sequencing various construction tasks and managing dependencies, ensuring timely project completion.
- Research and Development: Mapping complex research workflows, ensuring alignment with project goals and milestones.
These diverse applications highlight the versatility of workflow diagrams in managing projects and operational processes.
Tips for Effective Workflow Diagramming
Creating effective workflow diagrams requires attention to detail and a clear understanding of the process being mapped. Here are some valuable tips:
- Clearly Defined Criteria: Define specific start and end criteria for each task, ensuring clarity and accountability.
- Dependency Visualization: Show both mandatory and optional dependencies between tasks, highlighting critical paths and potential bottlenecks.
- Resource Allocation: Include resource requirements for each task, facilitating effective resource management and allocation.
- Software Integration: Consider integrating workflow diagrams with project management software for enhanced tracking and collaboration.
- Exception Handling: Plan for exception handling and rework loops to address potential disruptions and maintain workflow continuity.
These guidelines help create robust workflow diagrams that support effective project management and operational efficiency.
Why Use Workflow Diagrams?
Workflow diagrams earn their place among process mapping techniques due to their unique focus on task dependencies and sequencing. They offer a clear visual representation of how work flows through a process, facilitating effective planning, execution, and monitoring of projects. This visual clarity is essential for identifying potential bottlenecks, optimizing resource allocation, and ensuring timely completion of tasks. Workflow diagrams promote collaboration among team members and stakeholders, enabling efficient project management and improved operational efficiency. They are particularly beneficial for managing complex projects with multiple interconnected tasks and dependencies. By highlighting the flow and relationships between tasks, workflow diagrams provide valuable insights for process improvement and optimization.
8. Top-Down Process Maps
Top-down process maps provide a hierarchical view of a process, starting with a high-level overview and progressively decomposing it into finer details. This approach allows for a comprehensive understanding of complex processes by visualizing the relationships between different levels. It effectively connects strategic objectives with the operational activities required to achieve them. This structured approach makes top-down mapping particularly useful for large, complex processes.
Understanding Top-Down Decomposition
The core principle of top-down mapping is the breakdown of a process into increasingly granular sub-processes. The top level represents the overall process goal. Subsequent levels detail the steps, activities, and decisions involved in achieving that goal. This hierarchical structure reveals how individual tasks contribute to the larger objective. It facilitates a shared understanding of the entire process flow.
Practical Applications of Top-Down Maps
Top-down process maps are valuable in various scenarios. Examples include:
- Enterprise Architecture: Defining the high-level business processes and drilling down into individual business unit operations. This allows for alignment and standardization across the organization.
- Quality Management Systems: Documenting the overall quality management system and detailing specific procedures within each department. This approach ensures consistent quality practices across the organization.
- IT Service Management: Mapping the overall IT service delivery process and breaking down individual support procedures. This enhances clarity and efficiency in resolving IT issues.
- Regulatory Compliance: Illustrating the overarching compliance framework and outlining the specific procedures required to meet regulatory requirements. This approach helps organizations maintain compliance and minimize risks.
These applications highlight the versatility of top-down mapping in diverse organizational contexts.
Tips for Effective Top-Down Mapping
Creating effective top-down process maps requires a structured approach:
- Define Clear Level Criteria: Establish clear criteria for each level of detail to maintain consistency and avoid ambiguity. This ensures that each level provides the appropriate level of granularity.
- Consistent Naming Conventions: Use consistent naming conventions for processes and activities across all levels. This enhances clarity and facilitates navigation through the map.
- Maintain Clear Linkages: Clearly link parent processes to their child sub-processes. This maintains the connection between high-level goals and specific activities.
- Process Modeling Software: Consider using process modeling software with hierarchy support. These tools can automate the creation and maintenance of complex top-down maps.
- Regular Validation: Regularly validate the alignment between different levels to ensure that the detailed activities support the overall process objectives. This prevents discrepancies and ensures accuracy.
Following these tips ensures that top-down maps remain clear, concise, and effective.
Why Use Top-Down Process Maps?
Top-down process maps offer a structured way to understand and manage complex processes. Their hierarchical nature facilitates communication and collaboration by providing different levels of detail for different stakeholders. They ensure alignment between strategic goals and operational activities, promoting efficiency and effectiveness. This approach to process mapping is particularly valuable for large organizations or complex projects requiring a structured approach to process improvement. This structured approach provides a solid framework for analysis and optimization. They offer a valuable tool for organizations seeking a structured and comprehensive approach to process management. This makes them an essential process mapping technique for achieving organizational goals.
Process Mapping Techniques Comparison Table
| Technique | Implementation Complexity 🔄 | Resource Requirements ⚡ | Expected Outcomes 📊 | Ideal Use Cases 💡 | Key Advantages ⭐ |
|---|---|---|---|---|---|
| Flowcharts | Low 🔄 | Low ⚡ | Clear step-by-step process visualization 📊 | Simple to moderately complex processes | Easy to create, universally recognized symbols ⭐ |
| Value Stream Mapping (VSM) | High 🔄 | Moderate to High ⚡ | Identifies waste, improves flow, quantifies gains 📊 | Lean manufacturing and service processes prioritizing waste elimination | Comprehensive, aligns teams, supports lean ⭐ |
| Swimlane Diagrams | Moderate 🔄 | Moderate ⚡ | Shows responsibilities, handoffs, cross-functional clarity 📊 | Cross-functional processes needing accountability | Clarifies roles, shows handoffs, improves communication ⭐ |
| SIPOC Diagrams | Low 🔄 | Low ⚡ | High-level process scope and stakeholder identification 📊 | Project initiation, process scoping | Quick to create, aligns team understanding ⭐ |
| BPMN | High 🔄 | High ⚡ | Detailed, standard process models, supports automation 📊 | Complex business processes requiring automation | Industry standard, bridges business & technical ⭐ |
| Process Maps with Metrics | Moderate to High 🔄 | High ⚡ | Data-driven insights, performance bottleneck identification 📊 | Performance improvement with quantitative focus | Combines qualitative & quantitative analysis ⭐ |
| Workflow Diagrams | Moderate 🔄 | Moderate ⚡ | Clear task dependencies and resource planning 📊 | Task-oriented processes, project management | Identifies dependencies, supports automation ⭐ |
| Top-Down Process Maps | High 🔄 | Moderate to High ⚡ | Multi-level process documentation, strategic alignment 📊 | Large-scale documentation, multi-stakeholder environments | Scalable, maintains traceability across levels ⭐ |
Mapping Your Way to Success: Putting Process Mapping Techniques into Action
This article explored eight key process mapping techniques, each offering a unique approach to visualizing and analyzing workflows. From the simplicity of flowcharts to the comprehensive nature of BPMN, these tools empower businesses to dissect complex processes, pinpoint bottlenecks, and unlock opportunities for improvement. Remember, the goal isn't just to create a map, but to use it as a catalyst for positive change.
Key Takeaways for Optimized Processes
- Understanding Your Needs: The effectiveness of process mapping hinges on selecting the right technique. Consider your specific goals, the complexity of the process, and the level of detail required. A simple flowchart might suffice for a basic task, while a more robust method like Value Stream Mapping could be necessary for complex, cross-functional processes.
- Actionable Insights, Not Just Diagrams: Process maps are not just visual aids; they are powerful tools for driving action. Use them to identify areas for automation, eliminate redundancies, and optimize resource allocation. This leads to tangible improvements like reduced costs, faster turnaround times, and improved quality.
- Collaboration and Communication: Process mapping fosters collaboration by providing a shared understanding of how things work. This shared vision facilitates communication, reduces misunderstandings, and promotes buy-in from stakeholders.
From Mapping to Measurable Results
The true value of process mapping techniques lies in their ability to transform abstract workflows into concrete, measurable results. By incorporating metrics into your process maps, you can track progress, identify areas for further optimization, and demonstrate the impact of your efforts. This data-driven approach ensures that your process improvements are not just anecdotal but demonstrably effective.
Choosing the Right Technique for Your Business
Whether you're a bootstrapped startup streamlining operations or a seasoned marketing team optimizing campaigns, the right process mapping technique can be a game-changer. Flowcharts provide a clear overview of sequential steps, while Swimlane Diagrams clarify roles and responsibilities. SIPOC diagrams help define scope, while Value Stream Mapping identifies value-added and non-value-added activities. For more complex scenarios, BPMN offers a standardized and comprehensive approach.
Empowering Your Business with Process Mapping
Mastering these process mapping techniques equips your business with the tools to:
- Improve Efficiency: Identify and eliminate bottlenecks, streamline workflows, and reduce wasted time and resources.
- Enhance Customer Satisfaction: Optimize processes that directly impact the customer experience, leading to increased satisfaction and loyalty.
- Boost Profitability: By reducing costs and improving efficiency, process mapping contributes directly to increased profitability.
- Drive Data-Driven Decisions: Incorporate metrics to track performance, identify trends, and make informed decisions based on concrete data.
Process mapping isn't a one-time activity, but an ongoing process of refinement and improvement. By embracing these techniques and continuously evaluating your processes, you can create a culture of operational excellence and achieve sustainable growth.
Ready to transform your business processes and unlock their full potential? Bodhi Creative Collective specializes in helping businesses leverage the power of process mapping techniques to achieve operational excellence. Visit Bodhi Creative Collective to learn how we can help you map your way to greater efficiency, productivity, and success.
